
WinDbg is a multipurpose debugger for Microsoft Windows, distributed on the web by Microsoft. It can be used to debug user mode applications, device driver, and the operating system itself in kernel mode. It is a GUI application, but it has little in common with the better known, but less powerful, Visual Studio Debugger. (wiki)
I’ve mainly used WinDbg to determine which are the objects that consume the most memory inside an app. To do this you just need to follow few relatively simple steps.
Step 1 – Create a process memory dump
To create a process memory dump go to Task Manager, right click your process and click „Create Dump File”. In the screen shot I’ve use Chrome as an example but usually you will not do this. 🙂

If the app was compiled for a 32bit environment but it runs in a 64 bit environment then you will need to open the task manager using this command:
c:\windows\syswow64\taskmgr.exe
Using the default task manager in 64bit environment will create a 64bit dump for a 32bit process and it will not work in WinDbg.
Step 2 – Load the SOS Debugging Extension
To load the SOS Debugging Extension into the WinDbg.exe debugger, run one of the following commands in the tool depending on which .Net version the app was built upon:
.loadby sos clr - for .Net 4 & newer
or
.loadby sos mscorwks - for .Net 3.5 & 2
or
.load clr10\sos - for NET 1.0 and 1.1
or
.load c:\Windows\Microsoft.NET\Framework\{.NetVersion}\sos.dll
The CLR runtime dll was renamed to clr.dll with .NET 4. See which command works. For more details look here.
Step 3 – Run !dumpheap
This is the most powerful command when debugging a managed memory leak. It will show you all the objects on the managed heaps and using the different switches of !dumpheap you can display the output in virtually any way you want.
!dumpheap -stat will display the # objects and the total occupied memory per each custom or framework type.
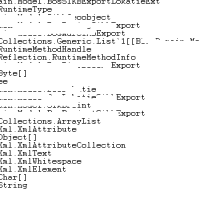
As you can see in the above screenshot, there were around 300MB occupied by String. Also ~300MB full of Char[].
Step 4 – Code investigation
With this information at your disposal you can now start to check:
- string operations (+, +=, etc) where a StringBuilder is not used.
- event += delegate where the event is declared as static.
- object serializations using constructors other that the one with Type
- XslTransform with Evidence parameter
- usage of COM objects
Visual Studio Support
Visual Studio also has (a limited) support for managed memory debugging and you can see more details here or in the video below.
WinDbg is far more powerfull even though not so user friendly.